
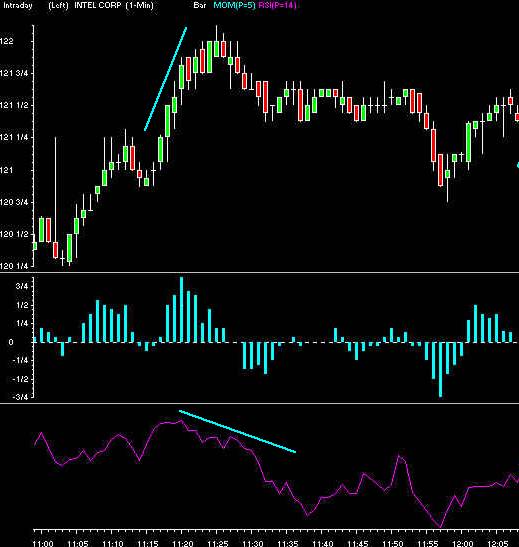
A Candlestick Chart with RSI
- RSI stands for Relative Strength Index. It is considered
a leading indicator.
 will
show you how to use the RSI, along with other indicators, to
help you locate a top or a bottom. This is a very popular indicator
for good reason. Look in the chart above. The purple line is
the RSI. What does it tell you?
will
show you how to use the RSI, along with other indicators, to
help you locate a top or a bottom. This is a very popular indicator
for good reason. Look in the chart above. The purple line is
the RSI. What does it tell you?
- You were probably looking for a correlation between the direction
of price and RSI. We look for the divergence; when the RSI is
going opposite in direction to the price.
Theprogram
makes learning easy and efficient. Unlike seminars or hours of
lecture,gives
you visuals to help you remember and the ability to review when
it fits your schedule.
BACK